Bitcoin technical Features engineering for better AI Time Series forecasting
White running AI tests I figured that I have missing piece in my training / predictive data. By taking any chunk of data from my dataset, that would be 12 hours for short-range AI and 36 hours of data for long-range AI, AI doesn’t know where this knifed out chunk would stand in long term trend. How can it know what has happened a week ago, if it only sees the data from today? I can’t just give 2016 rows of data and blindly feed the model, that’s too long. It won’t happen. Neural Networks can’t train like that. Here comes my solution - oscillators.
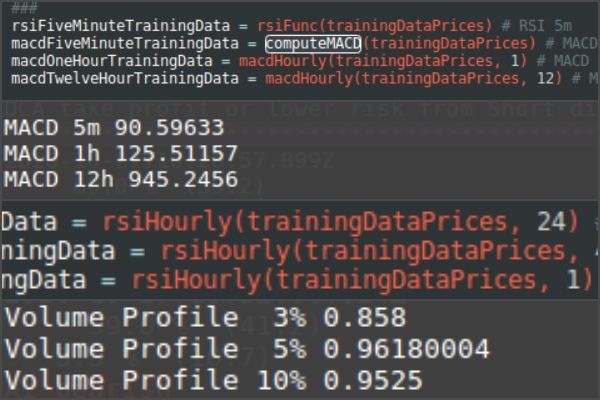
Moving Average Convergence Divergence (MACD) & Relative Strength Index RSI. There are many trading strategies with those two oscillators. I have no idea if those really work, like bullish/bearish divergences. But what really works, is that if you take 1D RSI and it is at the moment of writing 62.61 & MACD 12h is +314.22, now we know that for the last 14 days (RSI) & 13 days (MACD) we were trending up. Now we add up more. 4H RSI (58.72), 1H RSI (68.84), 5M RSI (63.44) & 1H MACD (+44.11), 5M MACD(+4.33), and we know that for the last 3 days we were trending down because 4H RSI is lower than other time frames but recently the trend is picking up again, you can see from 1H RSI & 1H MACD, and 5 min MACD shows that recently in two hours we moved 4 dollars up.
Now adding oscillators besides other data points that arrive every 5 minutes, my models can start learning how those data points are affecting current trends which now could be seen from oscillators.
But that wasn’t enough how I saw the market. How do I tell my models that there are very important price areas, for support & resistances. Like price dropping below 6K is a big deal since 6k has been established as long term support over the years. The problem was how do I put a volume profile for each price.
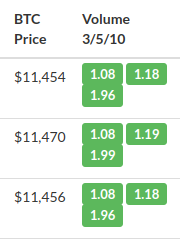
I came up with this solution. I am already collecting price and volume traded close to this price every 5 minutes. I even rebuilt a full dataset from 2011 August when Bitstamp started trading BTCUSD, Then I can do this. If I take the current price of $11,454 as I’m writing this and see the sum of volume traded above this price in my growing dataset collection, almost 10 years of trading and look for the sum of traded volume above the price 10% and 10% below the current price I get two numbers. I divide those two numbers and I get a ratio. This time ratio of volume profiling 10% from $11,454 is 1.96, meaning we have traded way more below the current price, in the trading world this would mean we have strong support. If the ratio would be below 1, that would mean that we’re facing resistance, since there is more volume traded above the current price. I’m doing the same technique with 3% / 5% / 10% range.
Now my AI models can see in what kind of trend they are and if we’re facing resistances or standing on support, add up all this with all other features I give the models which I’ve talked about in previous posts I end up with quite sophisticated dataset from which my AI models could learn a lot.
Posted 5 years ago by Darius
Add a comment