What are the bullish & bearish Bitcoin USD targets of January 9th, 2021
Bitcoin went into crazy Christmas mode, logging 14 green days and only two small red days in between. But how long this can last, what are the next bullish/bearish targets?
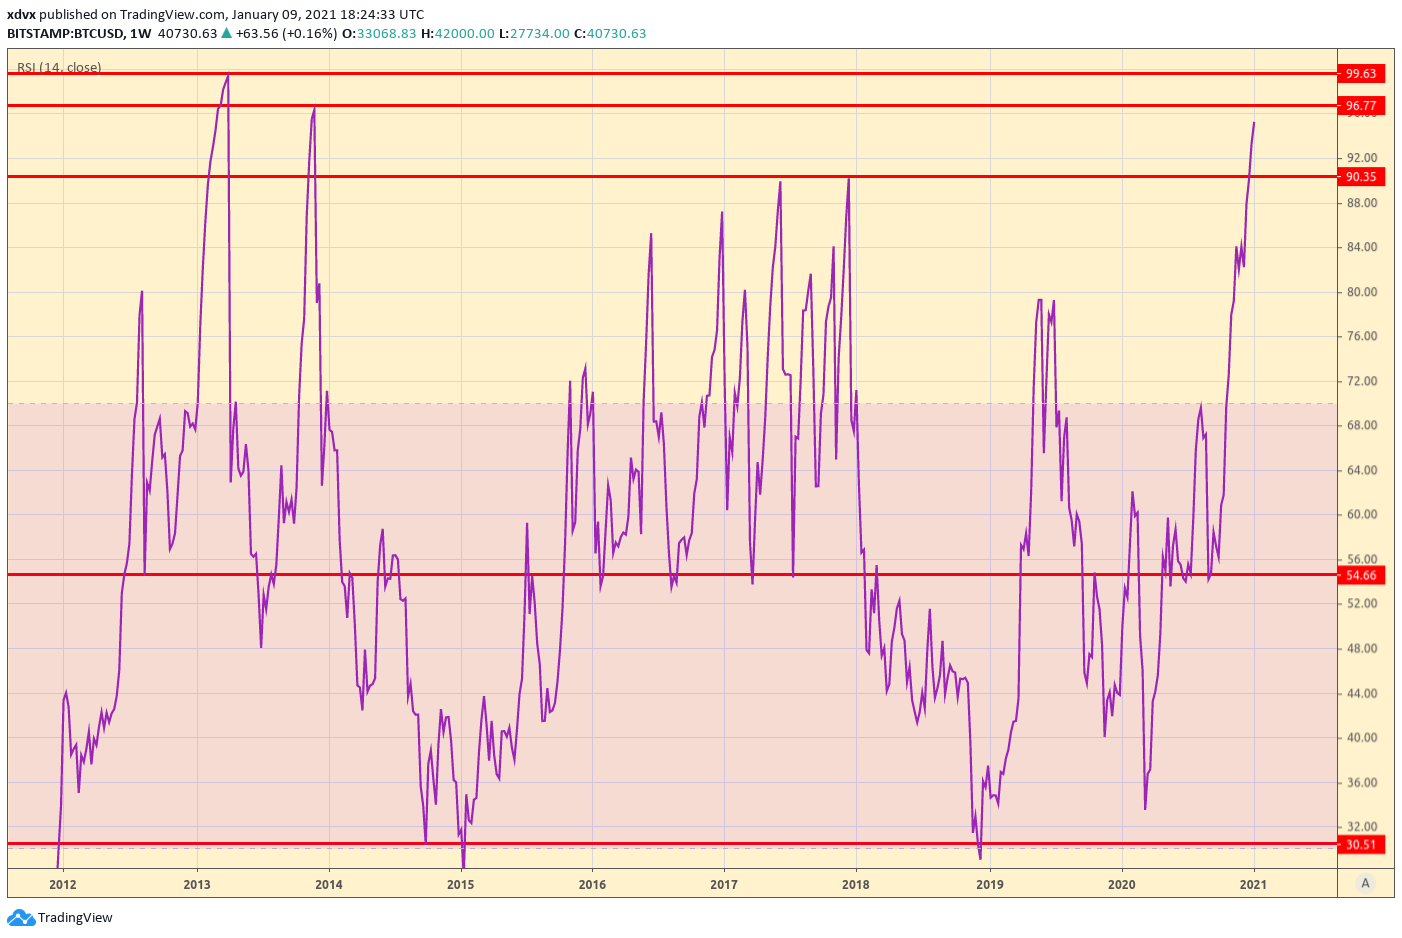
To take note of how heavy this rally is, take a look at Weekly RSI. It surpassed 2017 levels and is now approaching 2013 highest levels logged in Bitcoin’s history. Mind-blowing.
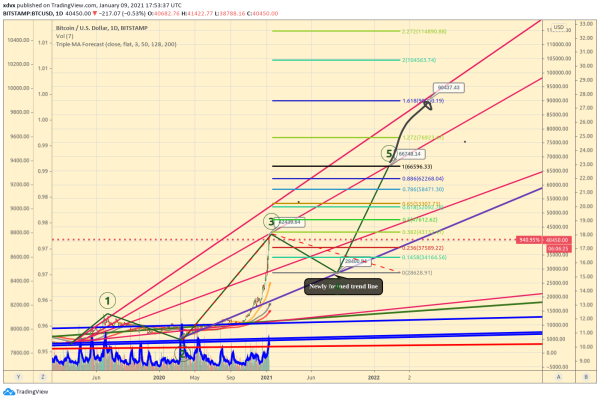
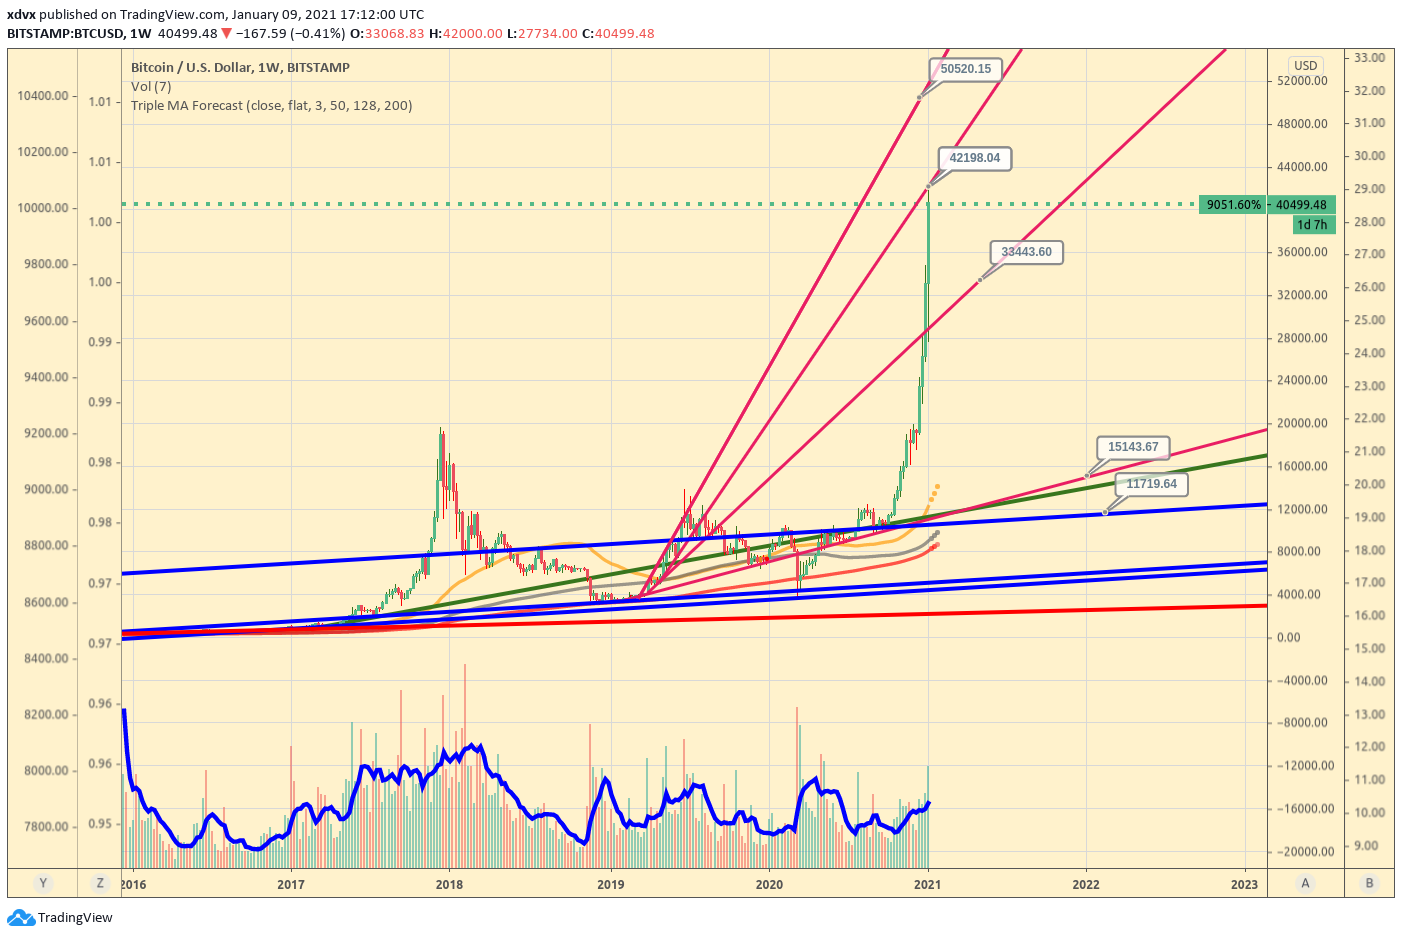
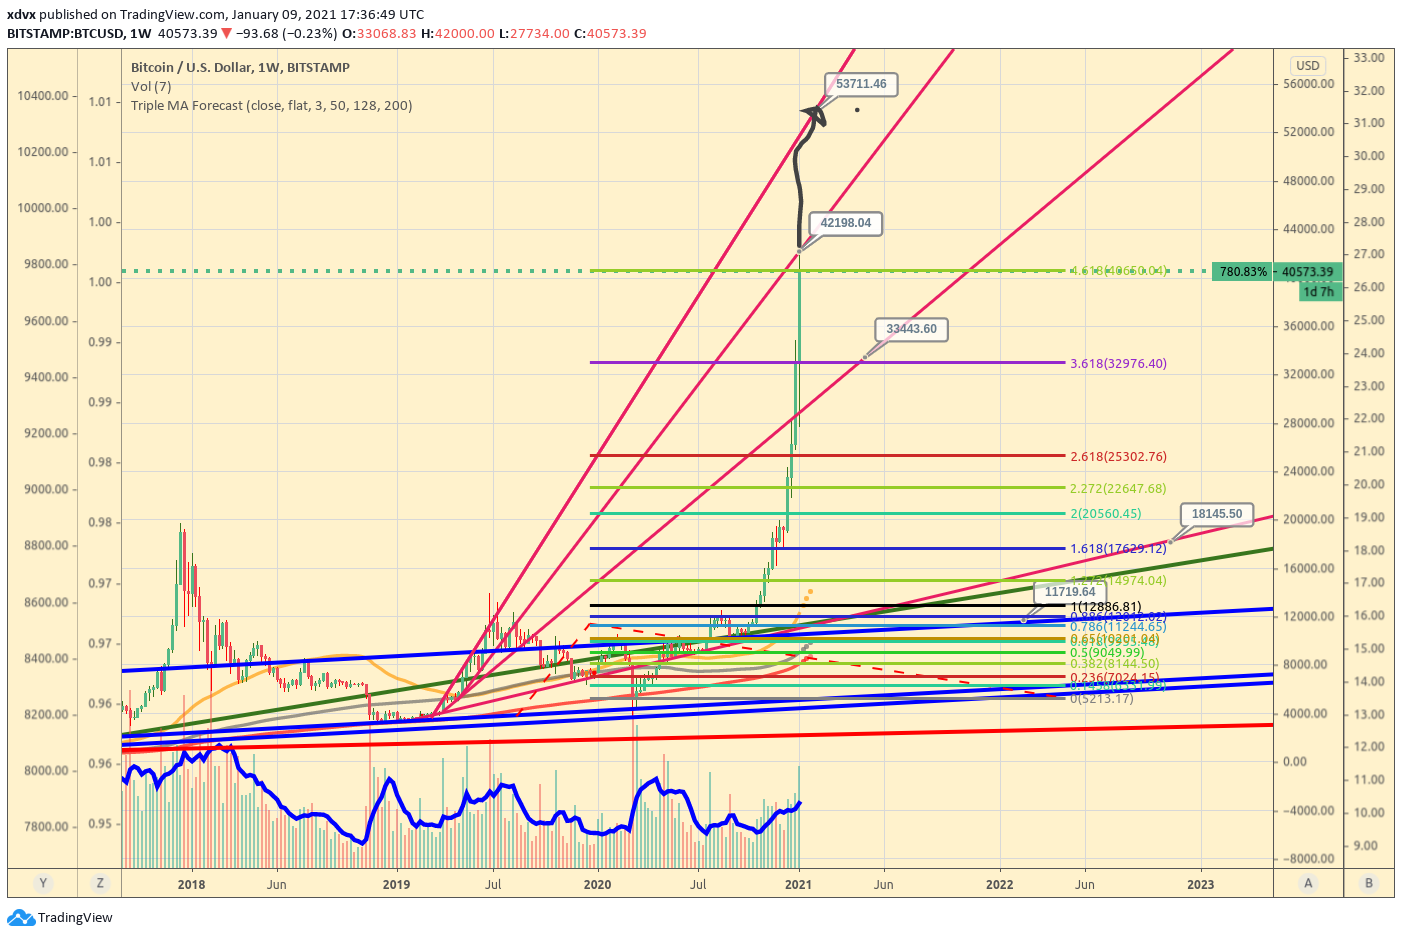
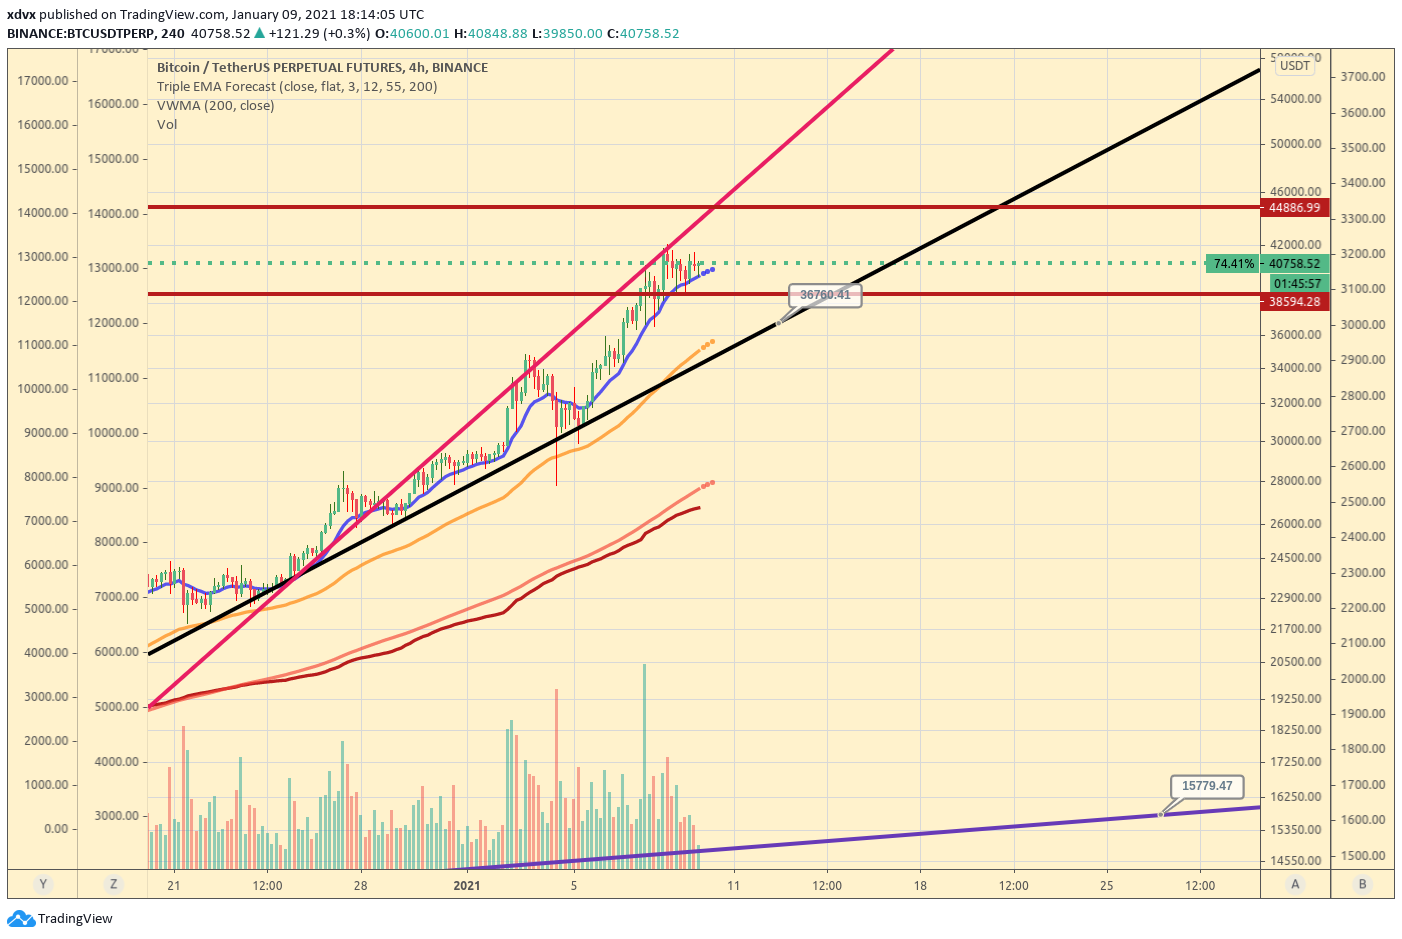
First, take a look at my 2019 non-log chart, funnily enough, these non-log weekly trend lines placed a year ago worked perfectly to find the current local resistance line at ~$42,000. Who would've guessed that bitcoin will start a crazy rally, ignoring all the indicators, all sell pressures, and will basically double in price in a matter of days?
One thing to have in mind is that the Total Crypto Market cap went from 600B to almost 1.1 Trillion. Have in mind that Gold Market Cap is roughly $10 trillion, so now cryptocurrencies went to 1 / 10 of the gold market cap. S&P 500 in comparison has a $31 trillion market cap. So now cryptocurrencies are in the mix with big boys.
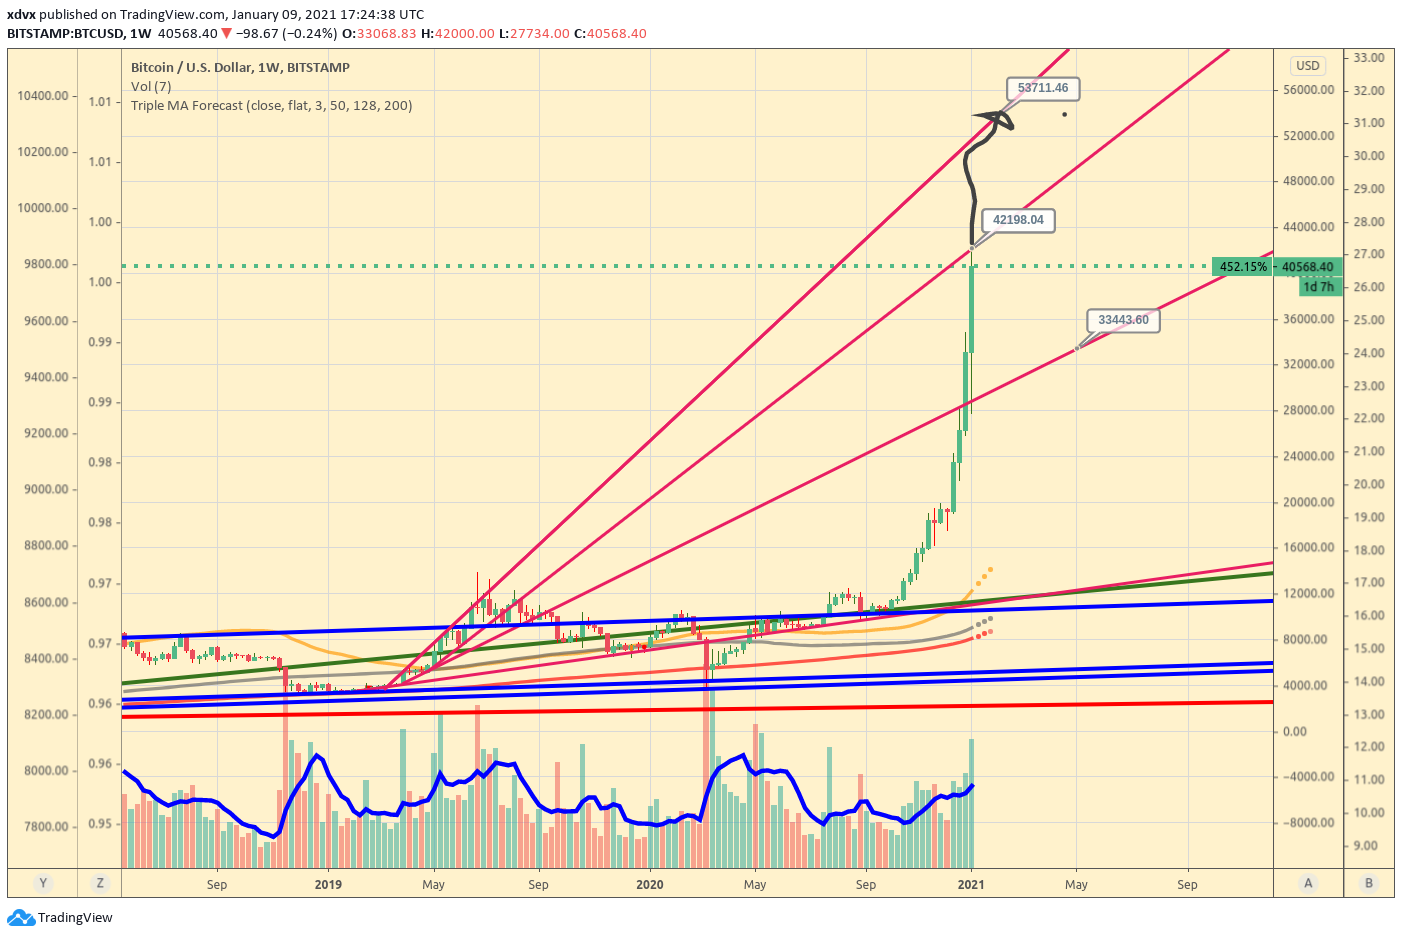
So what next to expect? Next bullish target if we surpass the bottom trend line of the 2019 rally, would be ~$53,000. That would hit the top of the trend, which was too strong and ended the previous rally.
If we assume that the current rally is another wave of the 2019 rally, we can try to add the Fibonacci extension. I had the highest ratio number in my extension at 4.618 and it is at $40,650.
That would make a beautiful point of correction. Make a note how the most famous 1.618 FIB extension had a price reaction and we surpassed that level only after some fight.
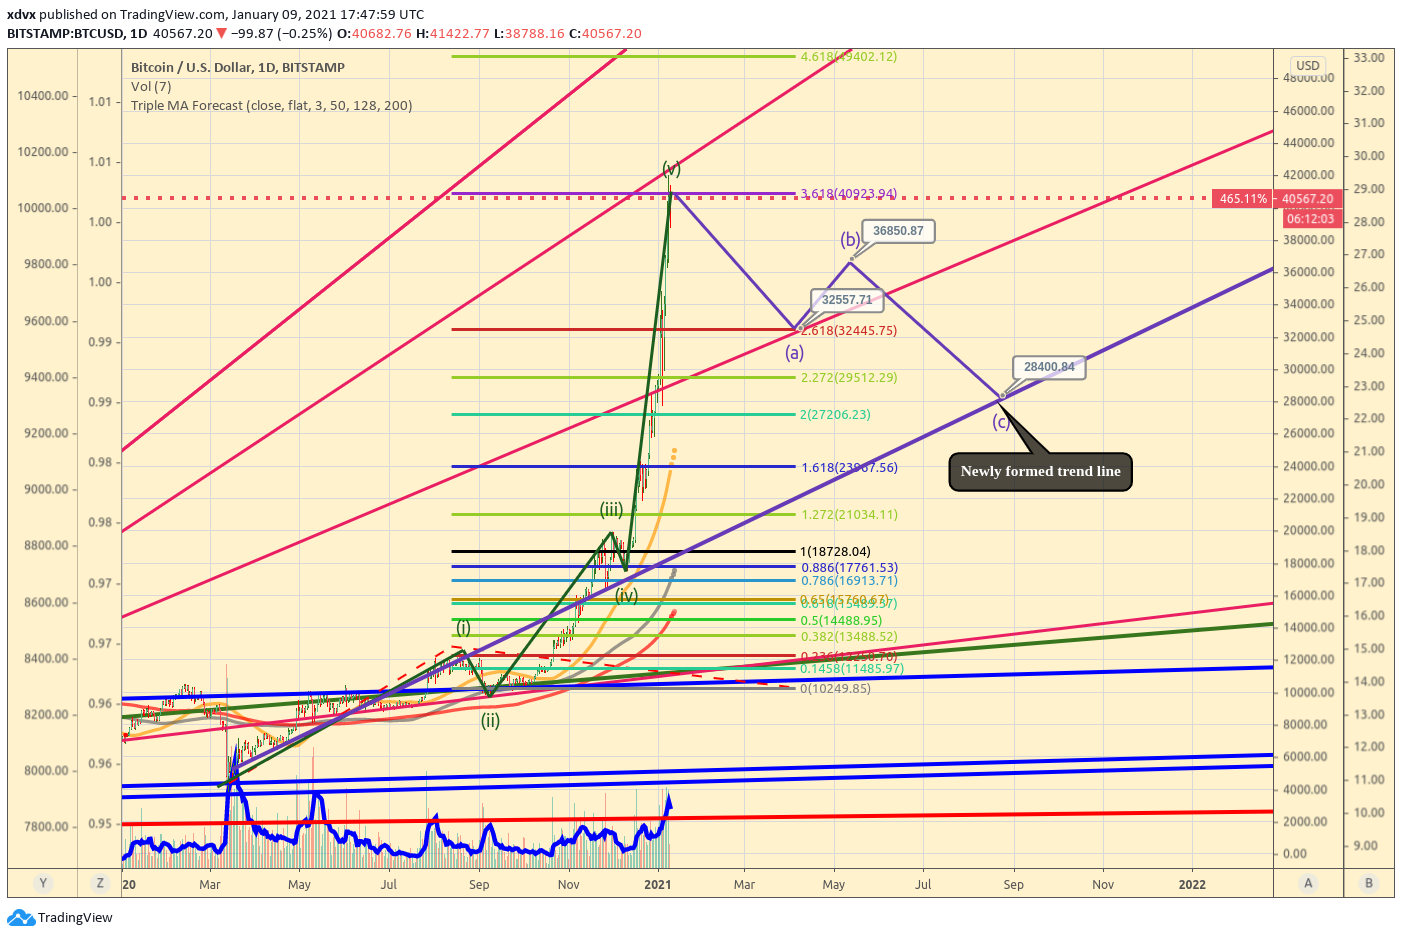
How all this could look in Elliott wave structure. I see waves something like that, with having 5th extended wave with parabola which is quite common in Bitcoin’s history. This would call for the first ABC correction. It should look something like this, the first retracement to $32,500, then price should recover to something like $36,850 and then drop to $28,400 which would match with possibly newly formed bullish trend line.
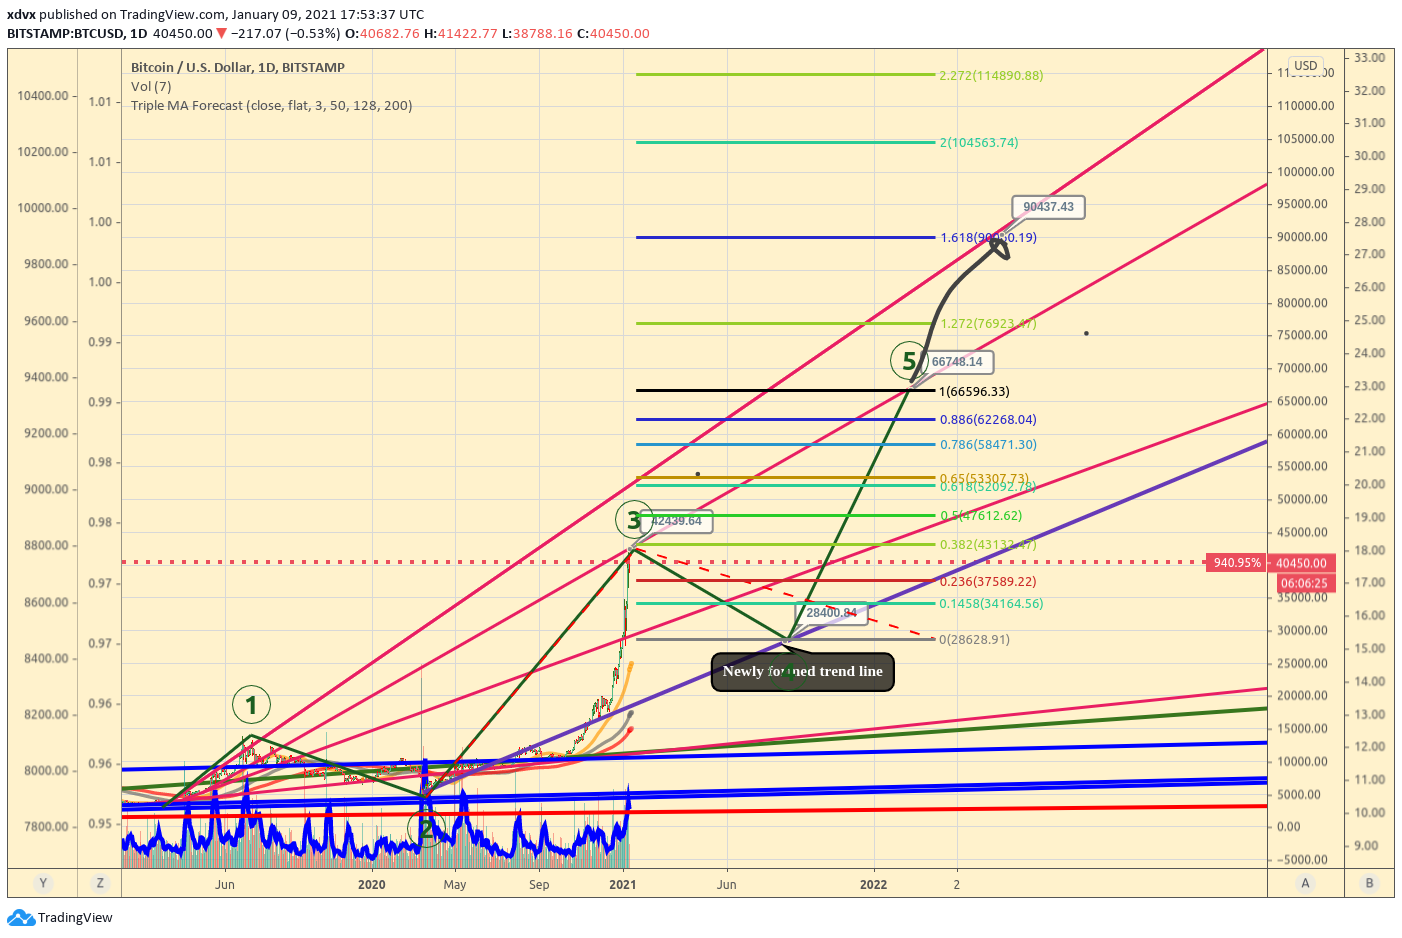
But if we continue to use Elliott waves for the possible bullish scenario, the bull market would be far from over. After the initial wave correction here would come a 5th final wave of this bull market. It should land somewhere on $66,750 or maybe extend even further to the $90,500 price range.
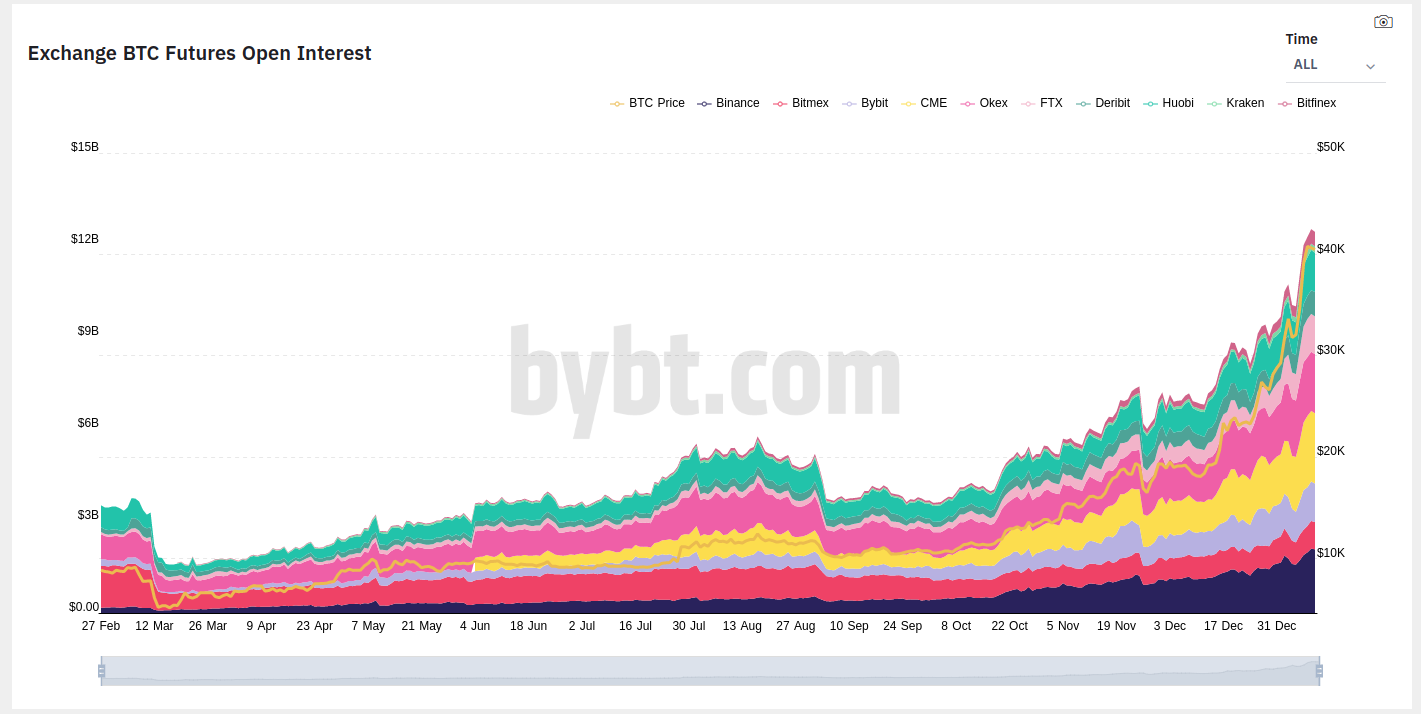
The most terrifying thing to watch right now. - Futures markets open interest. Futures went kind of the board with Open Interest. Meaning that there are open paper contracts for over 12 billion dollars. Following the increasing funding rate in the perpetual side for Longs, the Longs side is a bit more leveraged than the Shorts side. This could lead to the giant long squeeze, and those arbitrage bots would definitely clean spot exchanges bid side, causing even more liquidations on future derivative exchanges. This might cause a rapid price drop, the correction of this type wouldn’t be slow, it could slice 30-60% of the current price in a matter of days.
Other things to watch for reversal signals:
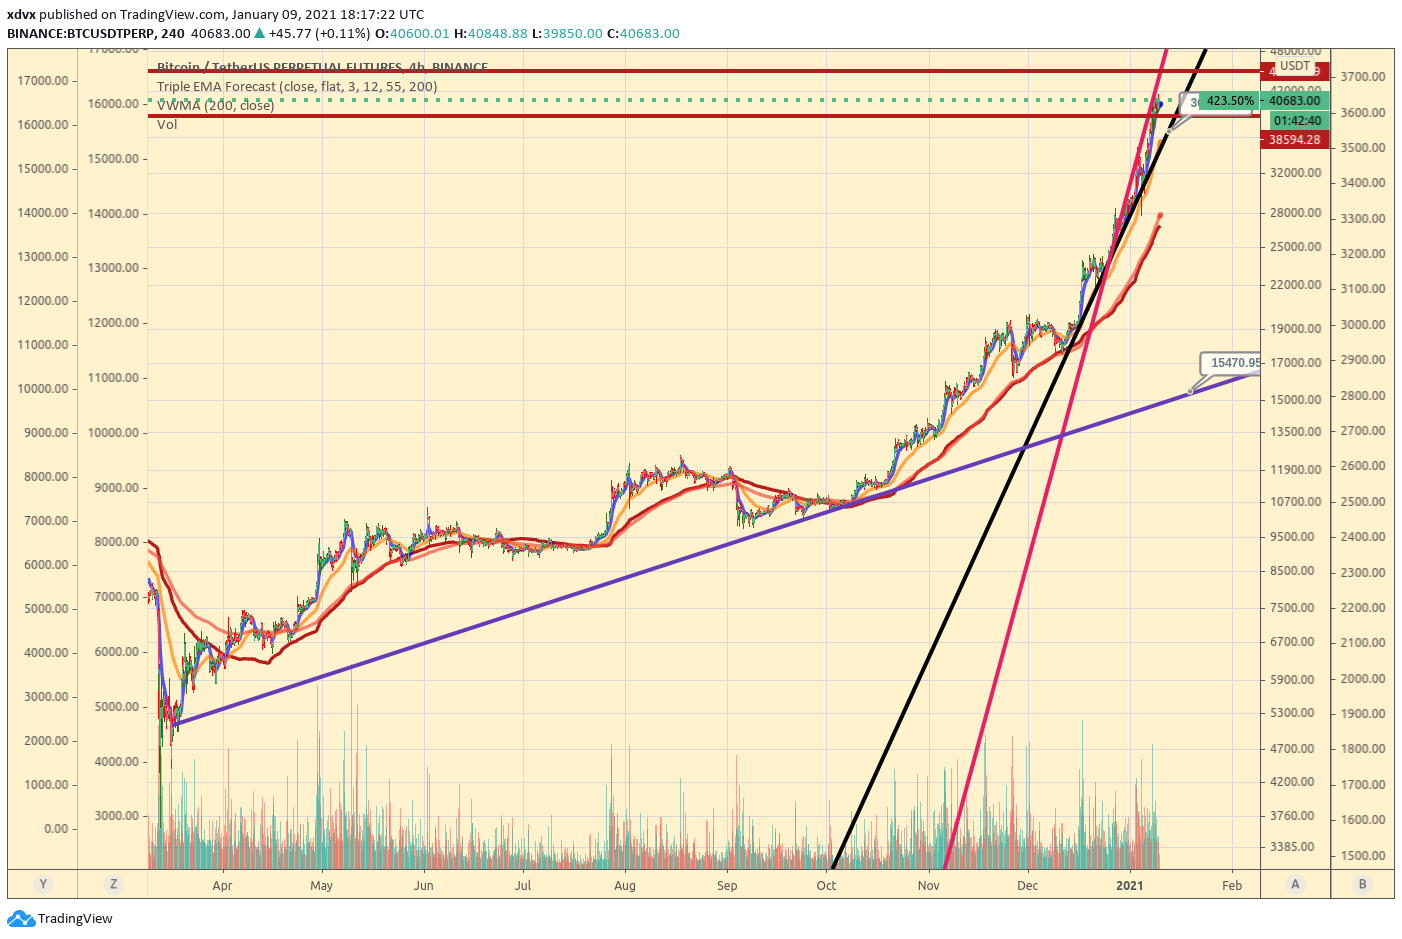
This magic black log 4H trend-line in Binance futures is holding this parabolic run straight from Christmas. The break of this trend line could cause parabola to break which in theory should return the price to the base of the parabola. Which is the dark purple line in this example, but the price number would cause the reaction in people that it is impossible. But in theory, after the break of the parabola, the price should return back to ~$16,000.
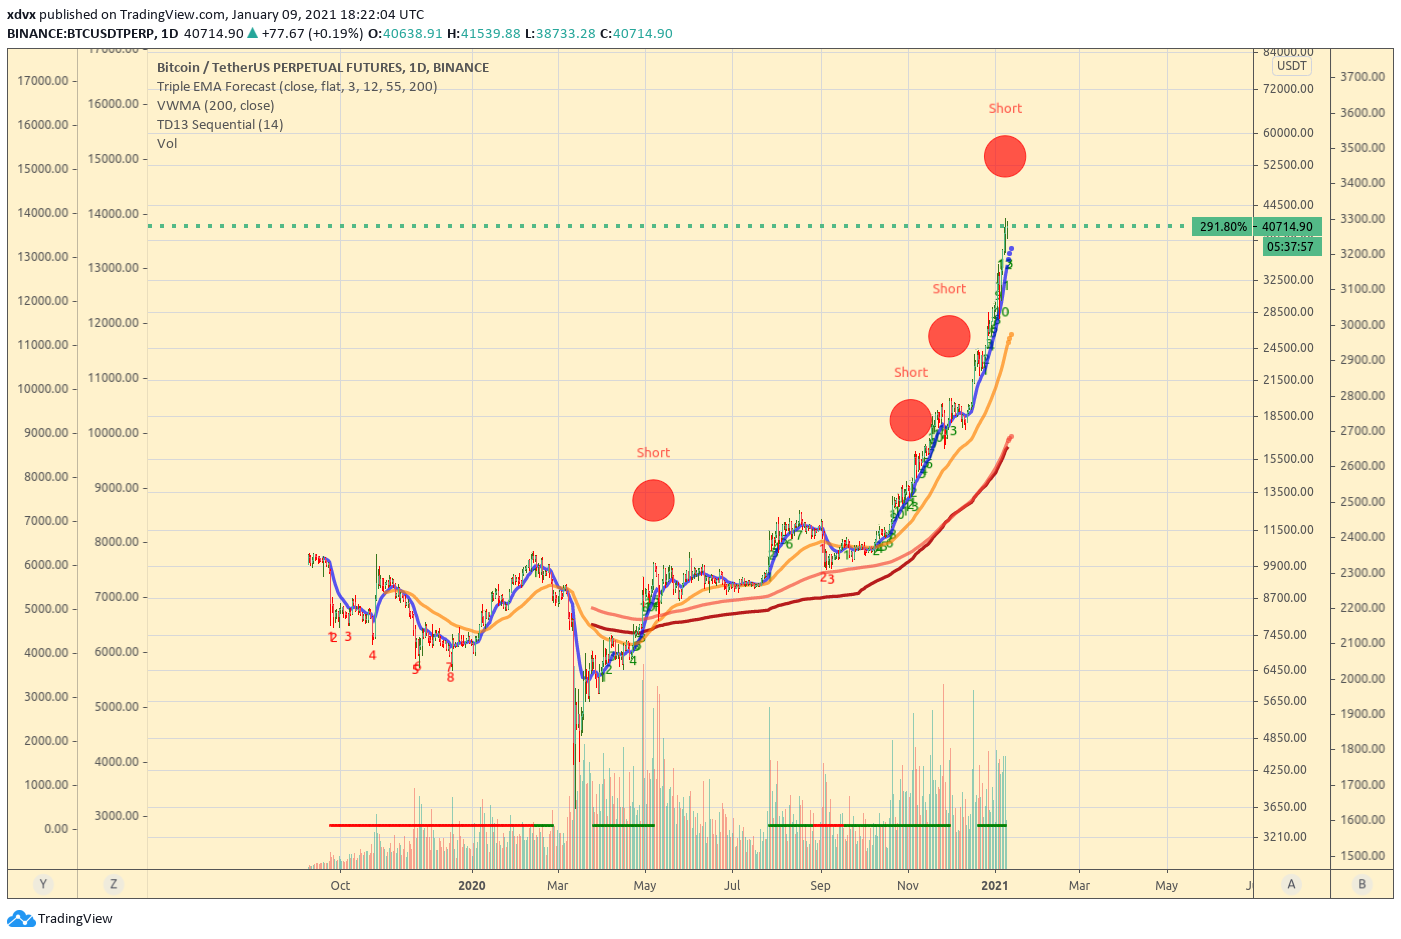
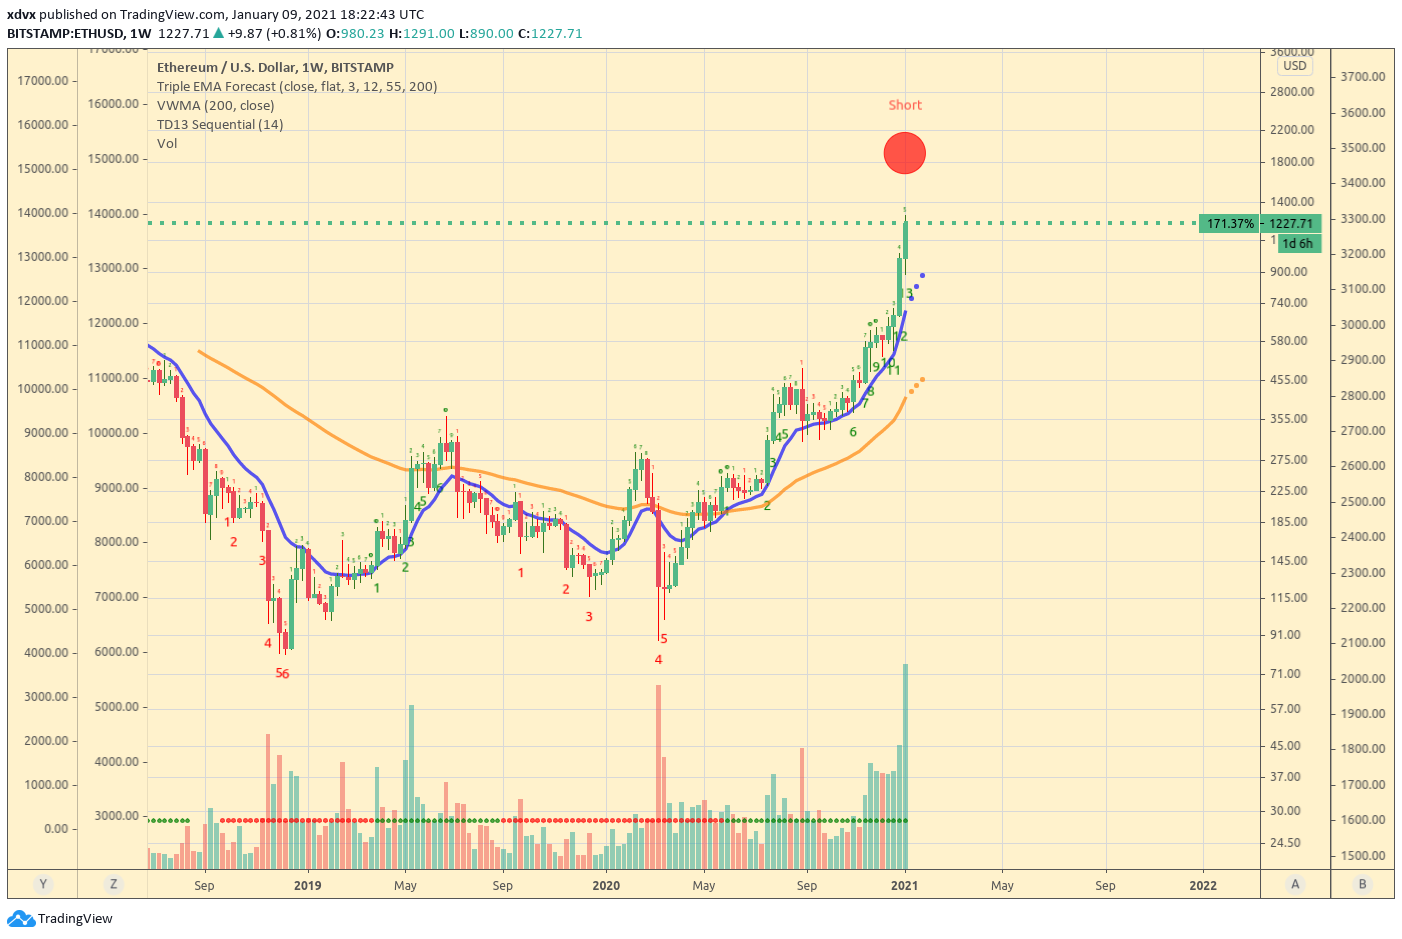
And the last is my beloved Strict TD9 system. Which had a really hard time in this run. It is really hard to find which market is leading the rally, but I have to share we have reversal signals again on Binance BTCPERPETUAL daily and ETHUSD Bitstamp weekly charts:
Posted 5 years ago by Darius
Comments
Love this
Add a comment